yyy">Estimation and Prediction about Y
Estimation of E[Yh]
At X=Xh the mean response is E[Yh]=β0+β1Xh. We estimate it with
μ^h=b0+b1Xh
Something about μ^h:
- Mean: Unbiased
- Variance: Cov(Yˉ,b1)=0 is the key
σ2(μ^h)=σ2[n1+Sxx(Xh−Xˉ)2]
- Under i.i.d. normal error terms μ^h∼N(μh,σ2(μ^)).
- s(μ^h)μ^h−μh∼tn−2.
Note that the closer Xh is to Xˉ, the more precise μ^h is. That why we say 线性回归适合做内差而不是外推。
Based on this significance tests and CIs can be obtained. For example, 100(1−α)% CI is
μ^h±tn−2,1−α/2s(μ^h).
Prediction of Yh
Model:
Yh=β0+β1Xh+ε
where ε is not any one among ε1,…,εN, but has the same property, say uncorrelated and having the same variance.
We still use μ^h to predict it. Here we need to consider ε. Let
dh=Yh−μ^h
we have
- Mean: Edh=0.
- Variance: The key is that ε⊥(ε1,…,εn).
σ2(dh)=V[(β0−b0)+(β1−b1)Xh+ε]=σ2[1+n1+Sxx(Xh−Xˉ)2]
dh∼N(0,σ2(dh))
- s(dh)dh∼tn−2.
The prediction intervals rely more on the normality assumption because ε is alone. There is no average to allow CLT to perform.
Mean of m New Observations
We still use μ^h as the estimator. Let
d=m1i=1∑mYinew−μ^h
Similarly
σ2(d)=⋯=σ2[m1+n1Sxx(Xh−Xˉ)2]
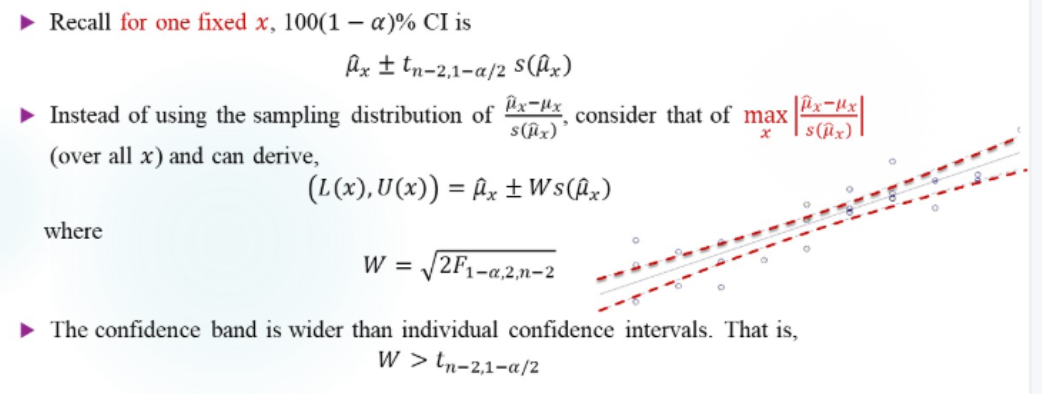
Confidence Band
If L(x),U(x) (sample-dependent) satisfy
P[L(x)<β0+β1x<U(x) ∀x]=1−α
Then the 100(1−α)% confidence band for the entire regression line is
{(x,y):L(x)<y<U(x),x∈R}
Note that we cannot just use the pointwise CIs to construct the confidence band. That is
∀x,P[L(x)<β0+β1x<U(x)]=1−α
Note that the "∀" changes place. It is a bit similar to the difference between single inference and joint inference.
Summary
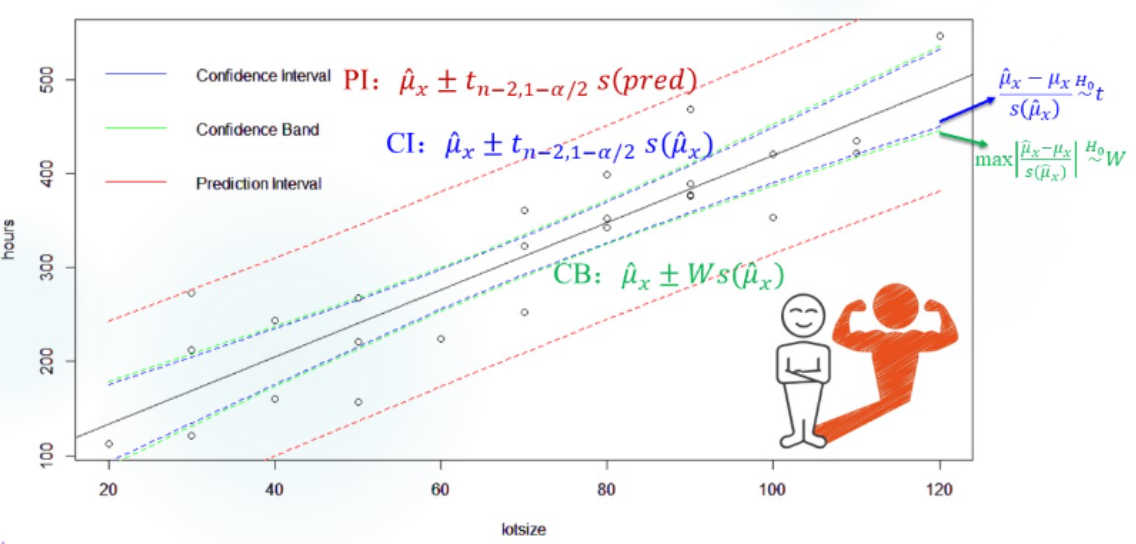
Prediction intervals are the widest. Confidence band is a little wider than CIs.
ANOVA
ANalysis Of VAriance.
Decomposition of Variation
∑(Yi−Yˉ)2=∑(Y^i−Yˉ)2+∑(Yi−Y^i)2
which is
SST=SSR+SSE
- T: Total
- R: Regression
- E: Error
- It can be interpreted as an orthogonal decomposition
In some literature, R stands for residual and E stands for explained. In that sense, the meaning is completely different.
Let's see their degrees of freedom:
- SST: n−1, easy to understand
- SSR: 1. It's because SSR=b12Sxx. It's defined by b1.
- SSE: n−2.
MST,MSR,MSE are defined by SST,SSR.SSE divided by their dfs.
As for the expectations, SST and SSE are easier to compute.
E(Yi−Yˉ)2⟹E(SST)=E(β1(Xi−Xˉ)+εi−εˉ)2=β12(Xi−Xˉ)2+nn−1σ2=β12Sxx+(n−1)σ2
And
E(SSE)=(n−2)σ2
So
E(SSR)=β12Sxx+σ2
Expected Mean Squares
E[MSR]E[MSE]=σ2+β12Sxx=σ2
When β1=0, they equals to each other.
Let's Have a Deeper Look at DF
The model
Y=Xβ+ε
Suppose rank(X)=k, full column rank. Then the projection matrix of X
P=X(XTX)−1XT
has the same rank as X. Note that Y^=PY. So
SSE=∥Y^−Y∥2=∥(P−I)Y∥2
has df of n−k, because rank(P−I)=n−k.
SST=∥Y−n111TY∥2=∥(I−n111T)Y∥2
has df of n−1 because rank(I−n111T)=n−1.
n111T is the projection matrix of 1.
SSR=⋯=∥(P−n111T)Y∥2
has df of k−1 because rank(P−n111T)=k−1.
Let J=n111T. Then J is the projection matrix of a subspace of R(P). So R(P) can continue to be divided into two orthogonal subspaces:
R(P)=R(P−J)⊕R(J)
Therefore rank(P)=rank(P−J)+rank(J).
Moreover, SST=SSR+SSE because
P−J⊥I−P
(It is easy to verify -- the multiplication is O.)
All thing above can be put in a nutshell:
Y=PY+(I−P)Y=(P−J)Y+JY+(I−P)Y
Subsequent orthogonal decomposition. In this note we will show that (I−P)Y can continue to be orthogonally decomposed.
F-test
H0:β1=0
When this holds, MSR tends to be larger than MSE. And because they all follow chi-square distribution and they are independent, we can set
F=MSEMSR∼FdfR,dfE
as the test statistic. When it's large enough, we can reject H0 according to our significance level.
General Linear Test
A different view of the simple F-test.
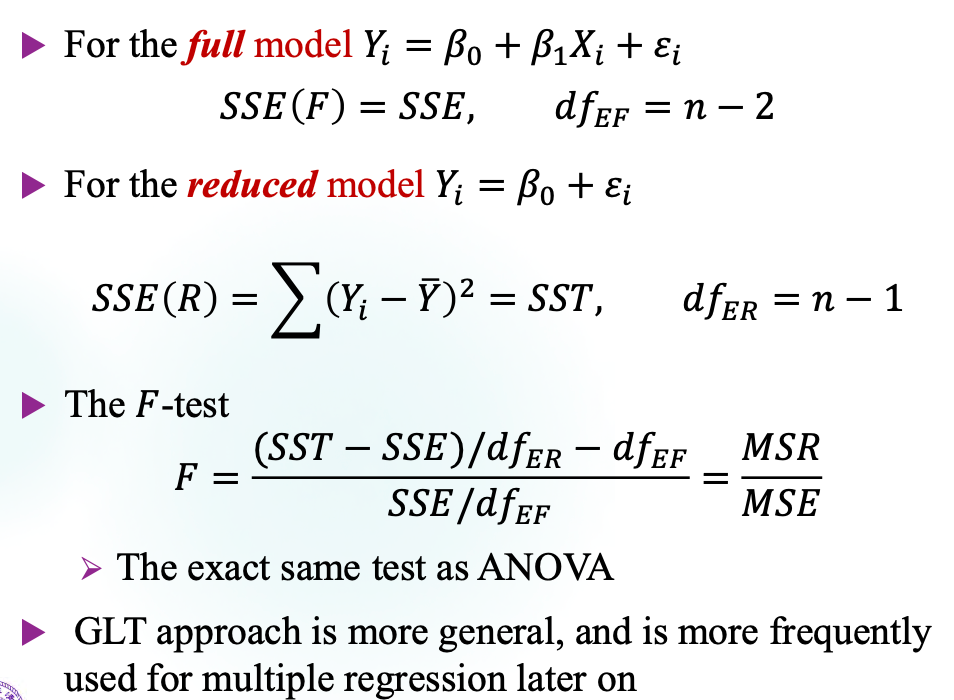
The principle is to compare the SSE of each model. The full model should have less SSE because we hope it can do better. More generally, the F-statistic should be written as
SSE(F)/dfEF[SSE(R)−SSE(F)]/(dfER−dfEF)