Prob-1
β^1OLS=∑i=1N(xi−xˉ)2∑i=1N(xi−xˉ)(yi−yˉ)
β^0OLS=yˉ−β^1xˉ
Prob-2
β^0ML,β^1MLσ^2,ML=β^0LS,β^1LS=n∑ei2
Prob-3
1.29
It means that the expected value of Y is 0 given X=0. The curve of the function passes (0,0) on a graph.
1.41
a.
Solve
β^1argmini=1∑n(yi−β^1xi)2
we get
β^1OLS=∑i=1nxi2∑i=1nxiyi
b.
L(β1∣X,Y)=i=1∏nfYi(yi∣β1,σ2,X)=⋯exp(−2σ21i=1∑n(yi−β1xi)2)
β^1ML=argmaxβ1L(β1∣X,Y)=argminβ1∑i=1n(yi−β1xi)2=β^1OLS
It's the same as the least square estimator.
c.
Eβ^1ML=E[∑i=1nxi2∑i=1nxiyi]=∑i=1nxi21E[i=1∑nxi(β1x1+εi)]=∑i=1nxi21i=1∑n(β1xi2+xiEεi)=β1
Prob-4
a.
No. I don't know the exact distribution of ε.
b.
Y=100+20⋅5+ε where ε∼N(0,25), so
P(195<Y<205)=P(−5<ε<5)=Φ(1)−Φ(−1)
where Φ(⋅) is the CDF of standard normal distribution.
Prob-5
a.
The data obtained in the study were observational data because no experiment was made.
b.
It is not very valid. Relationship does not mean causality.
c.
Age, occupation
d.
Add more variables into the regression so that the error term has zero expectation. Or use instrumental variables to get the real effect.
Prob-6
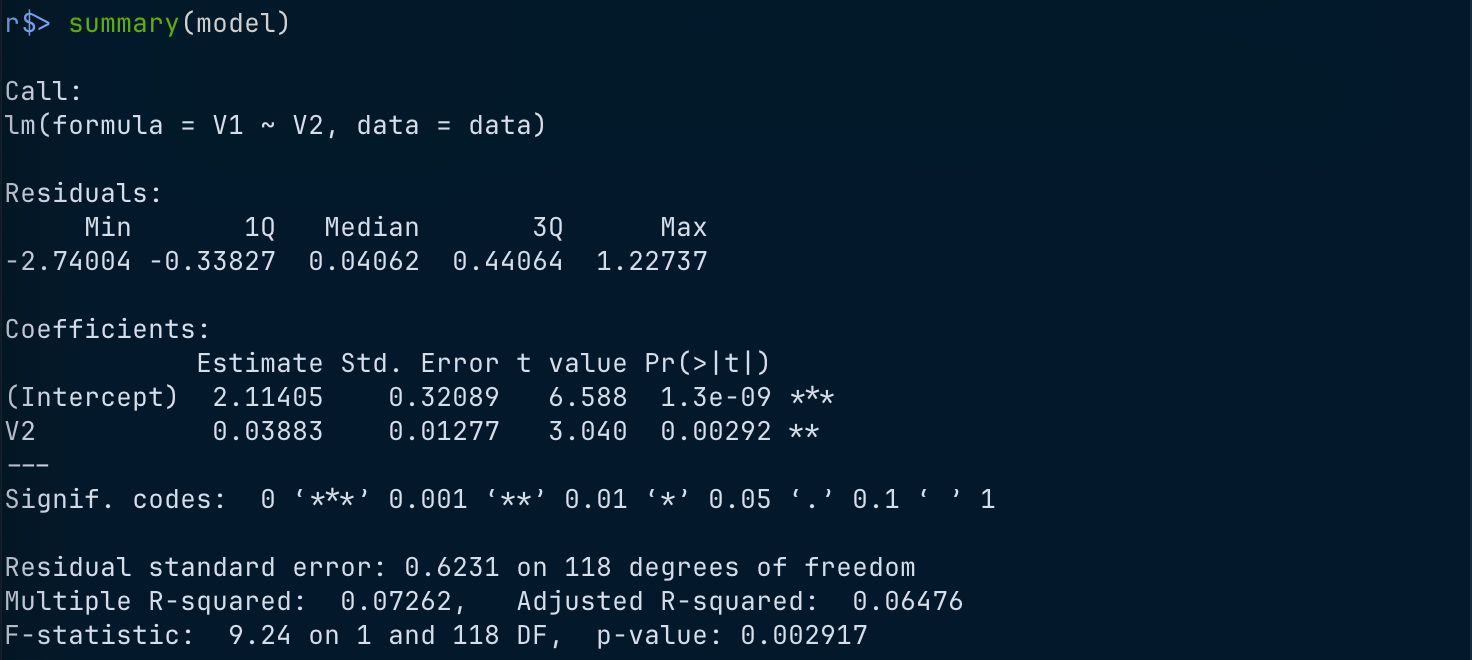
a.
β^0=2.11,β^1=0.039
The estimated regression function is
y^=2.11+0.039x
b.
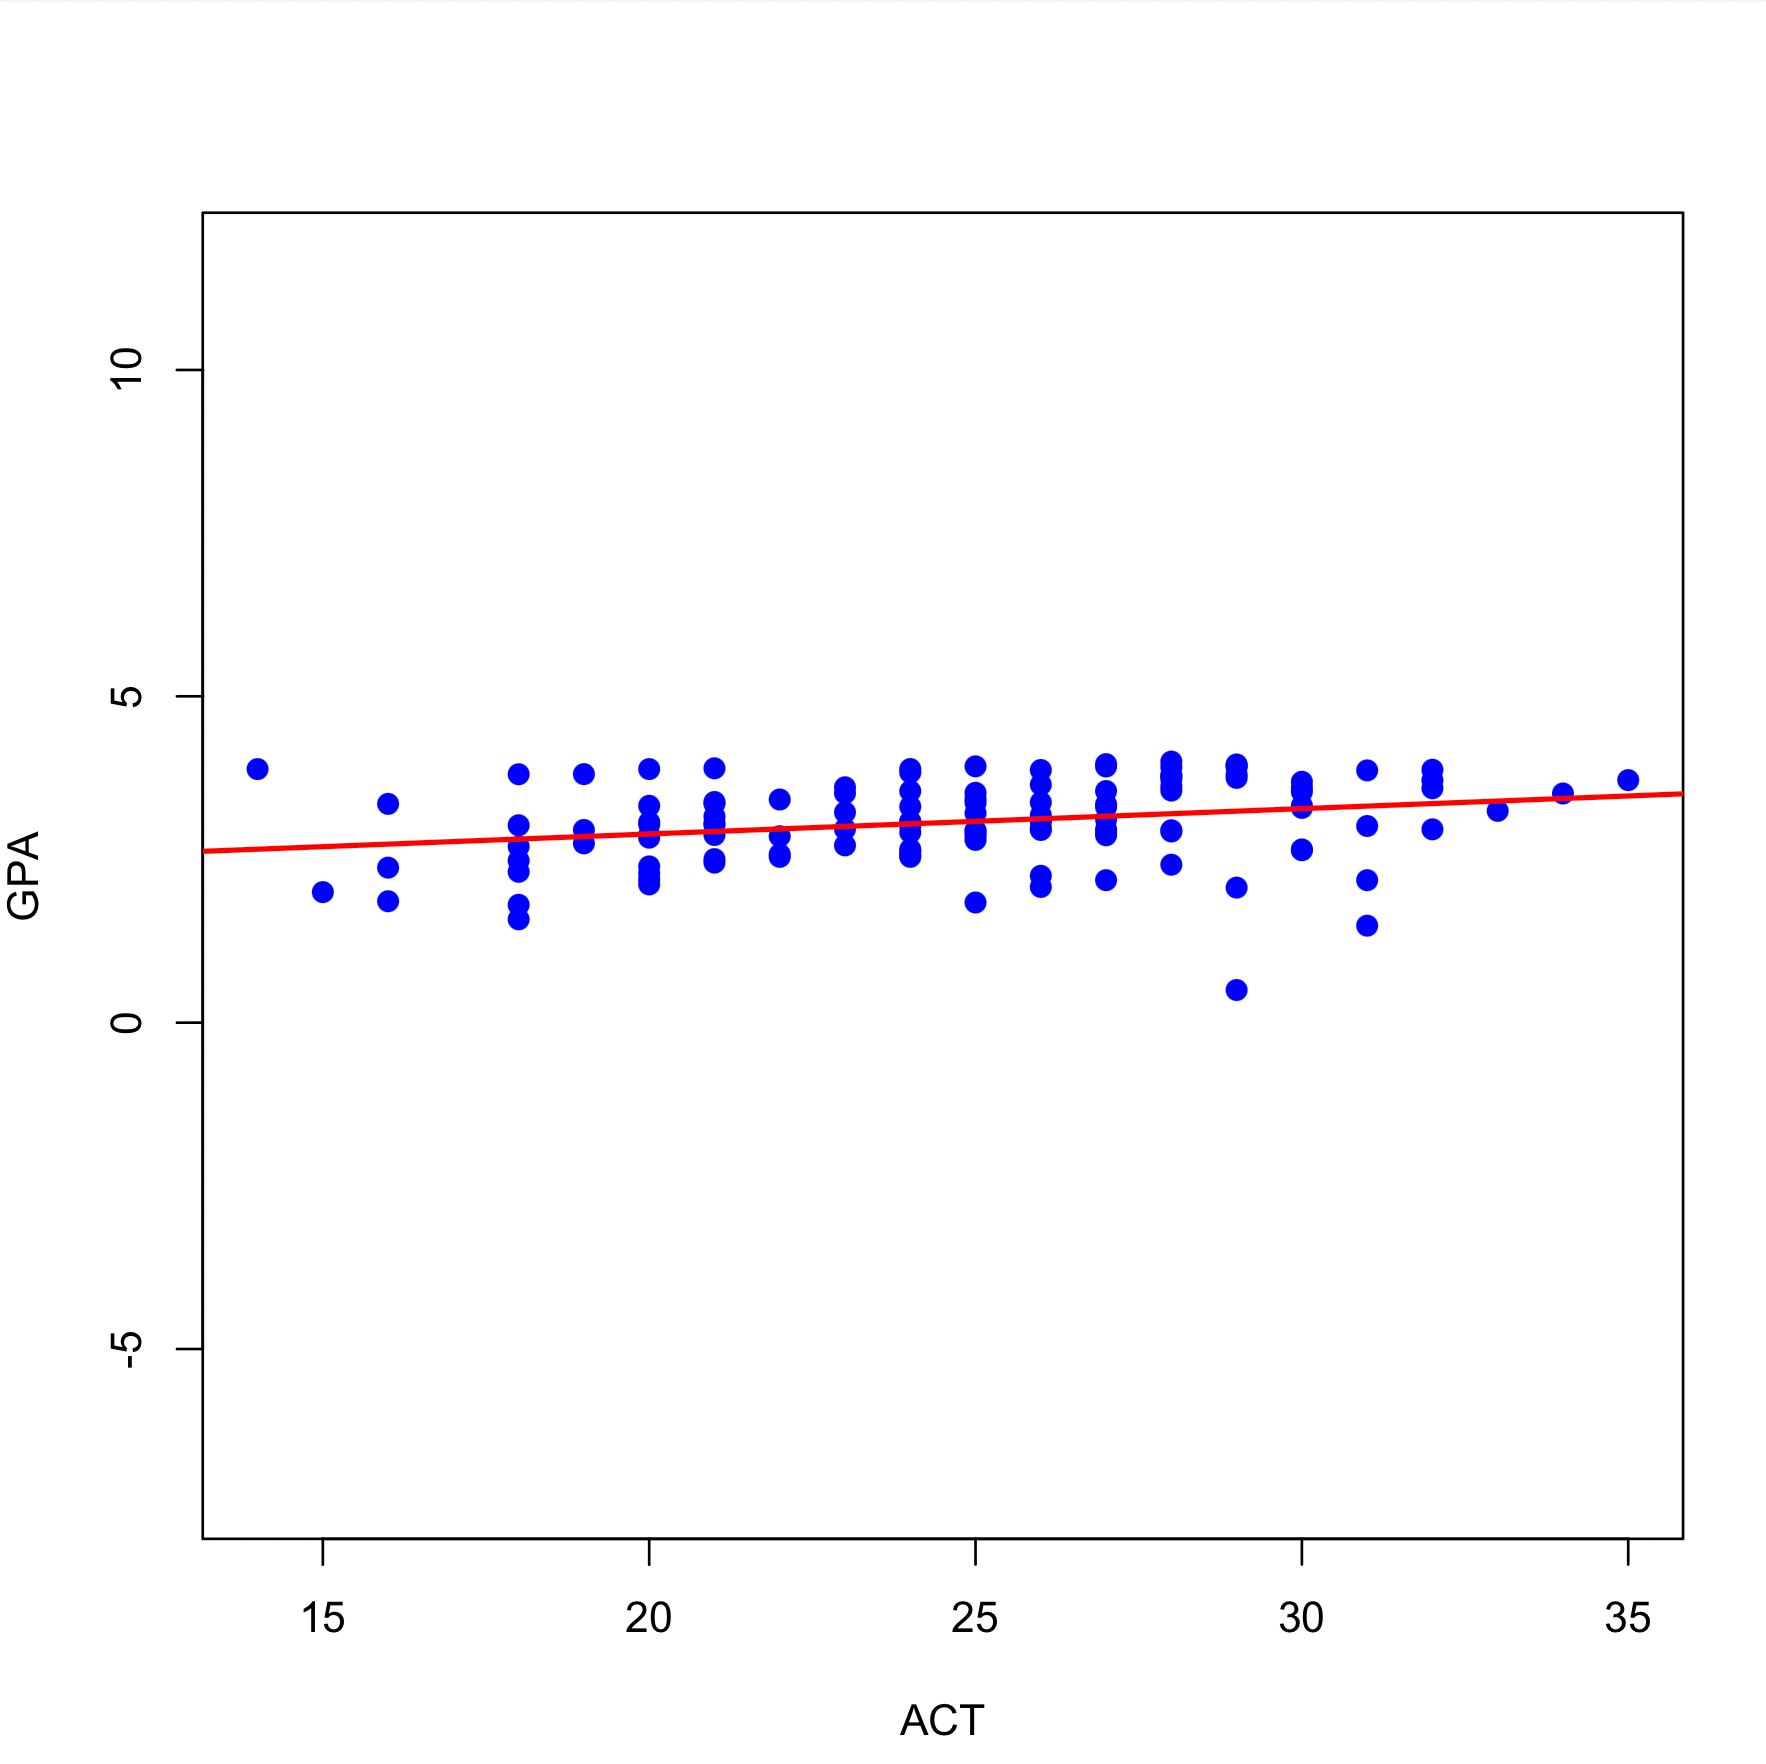
It seems good.
c.
3.278863
d.
0.038.