Prob-1
1-a
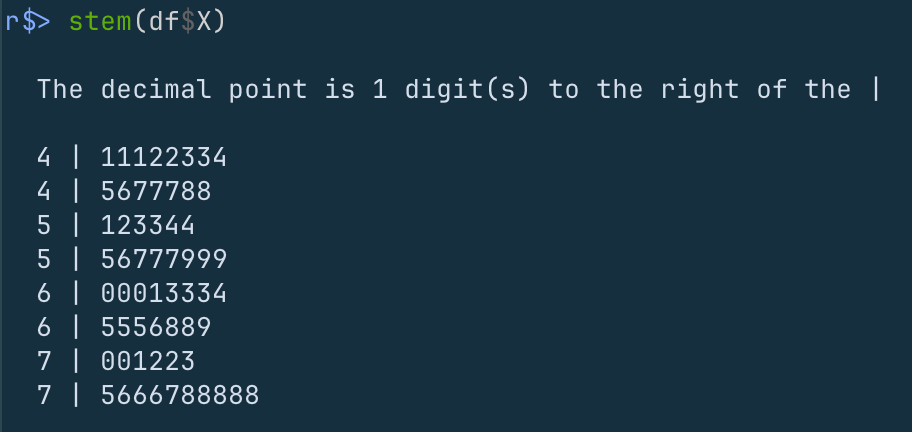
Consistent, as the age groups are similar in size.
1-b
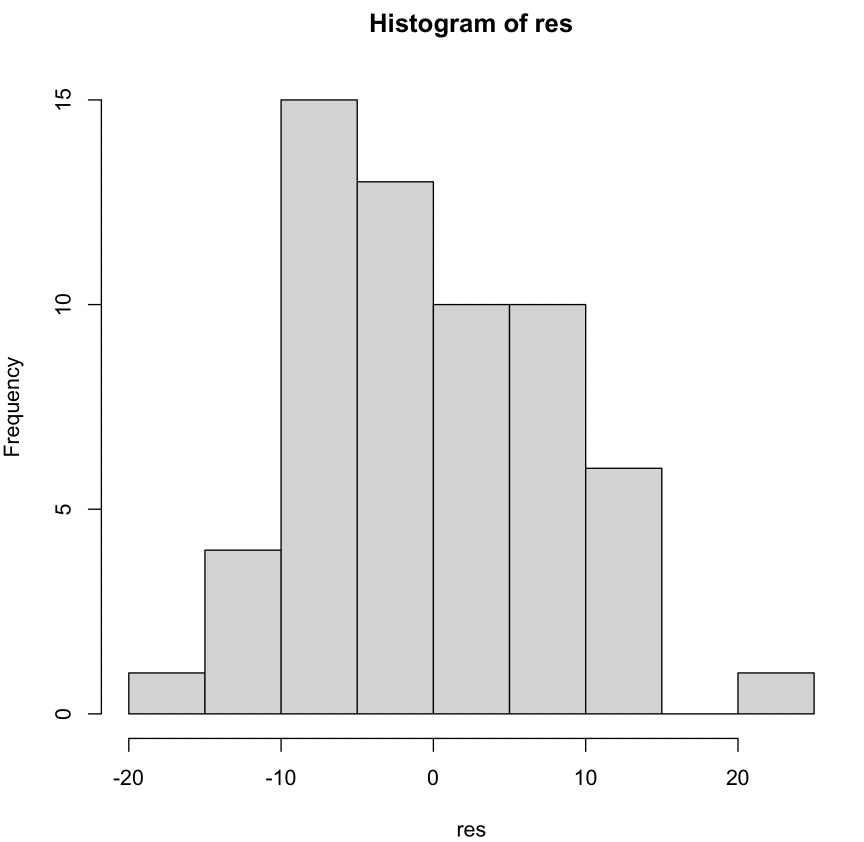
The residuals present good normality.
1-c
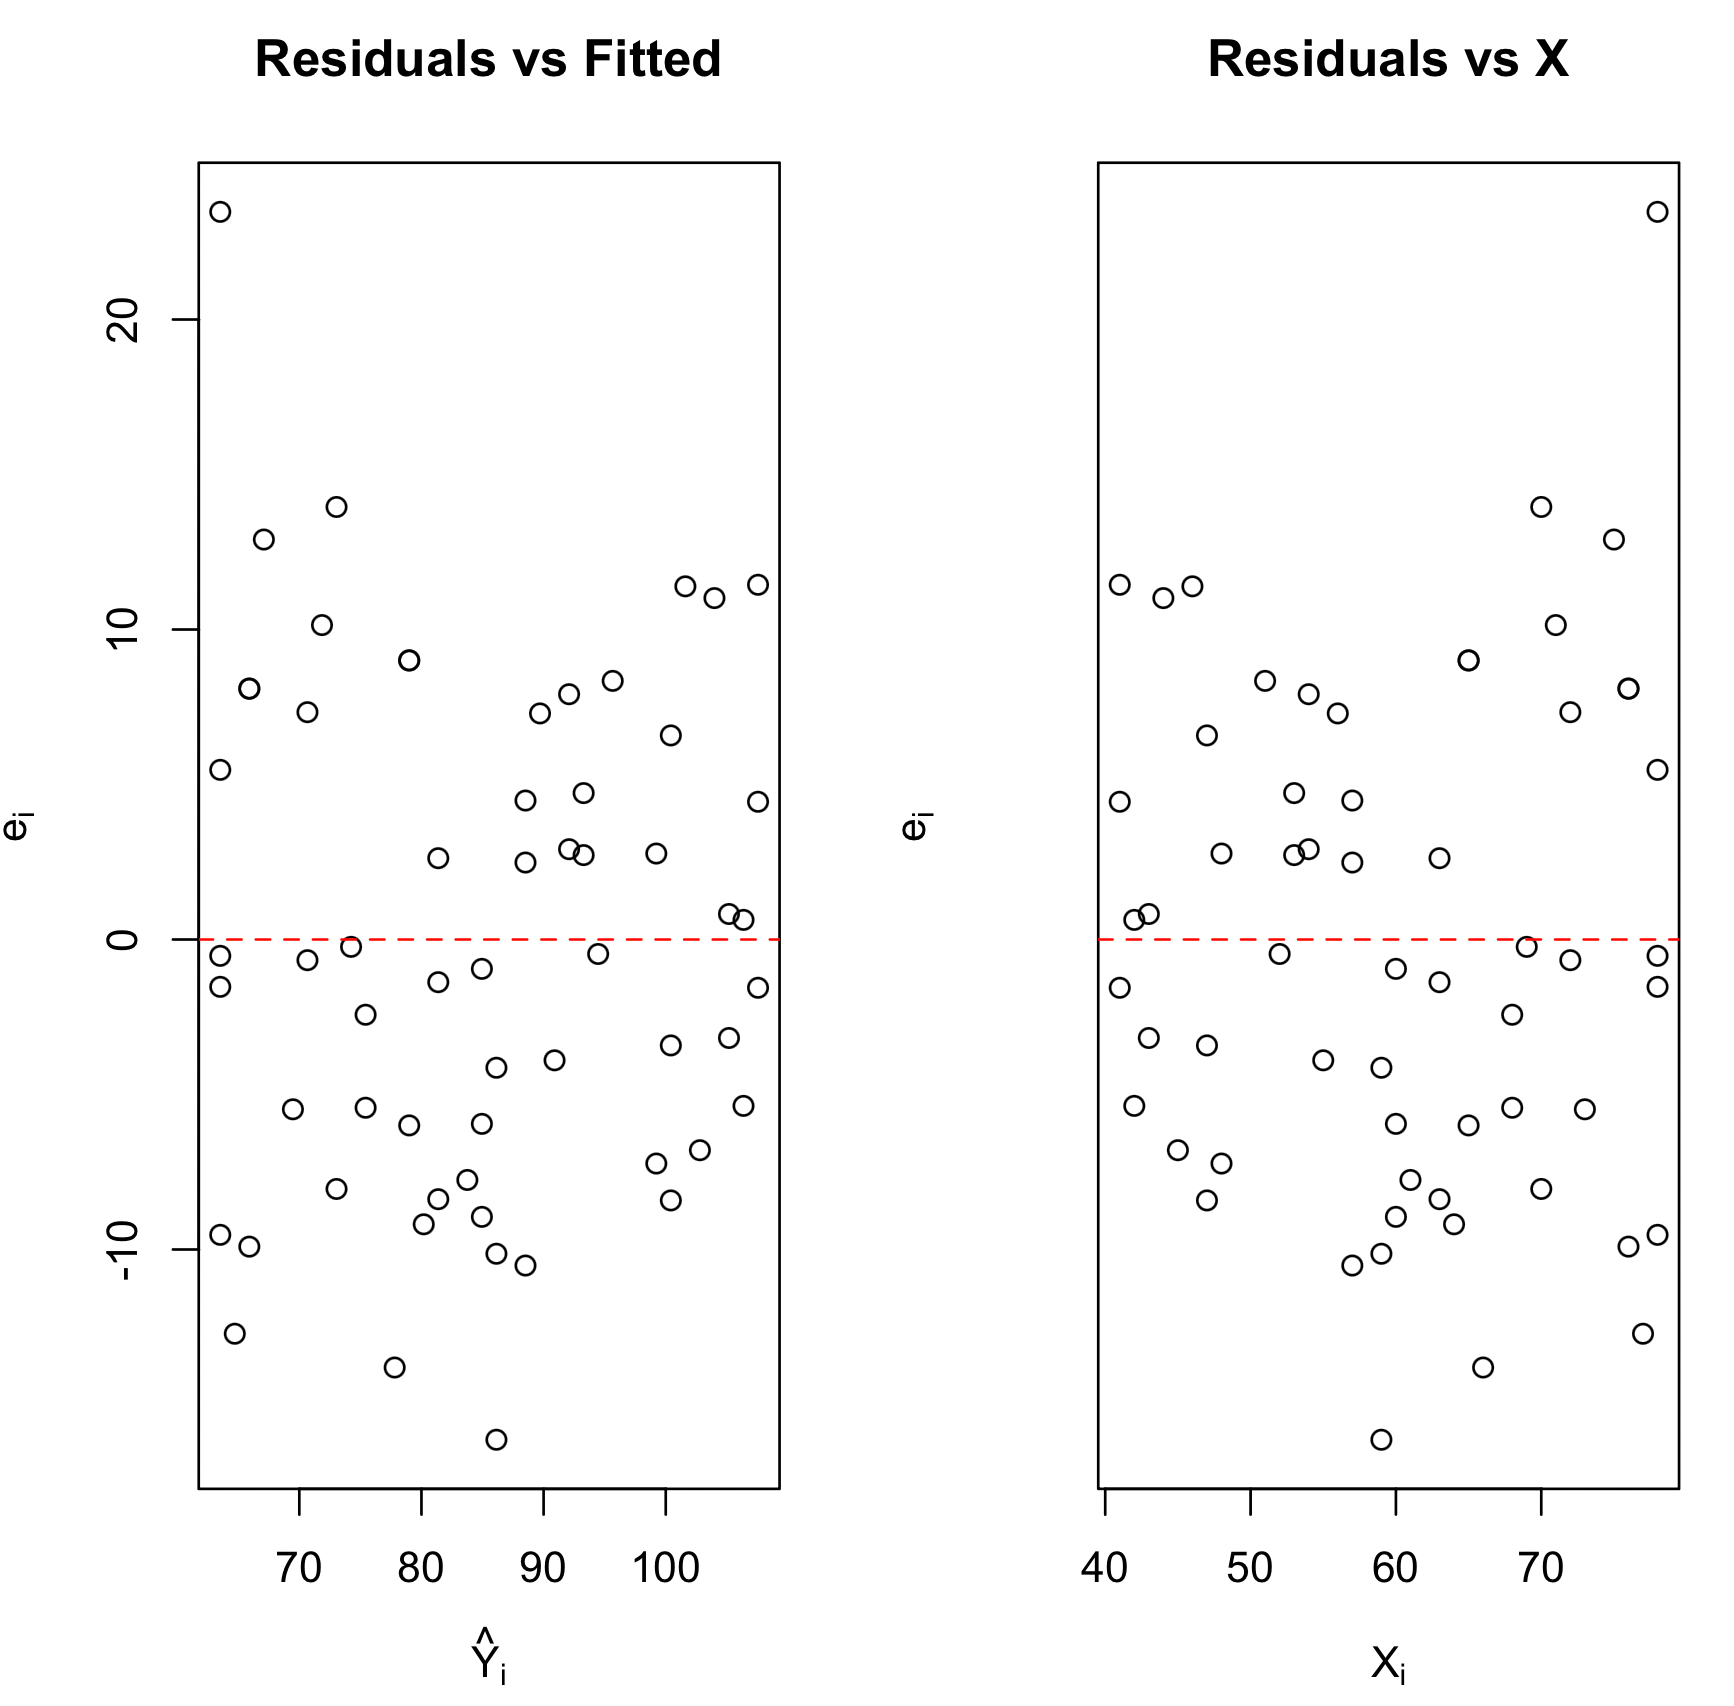
The two plots provide the same information as Y^i is a linear transformation of Xi.
The two plots ascertain E(ε∣X)=0 and V[ε∣X]=σ2.
1-d
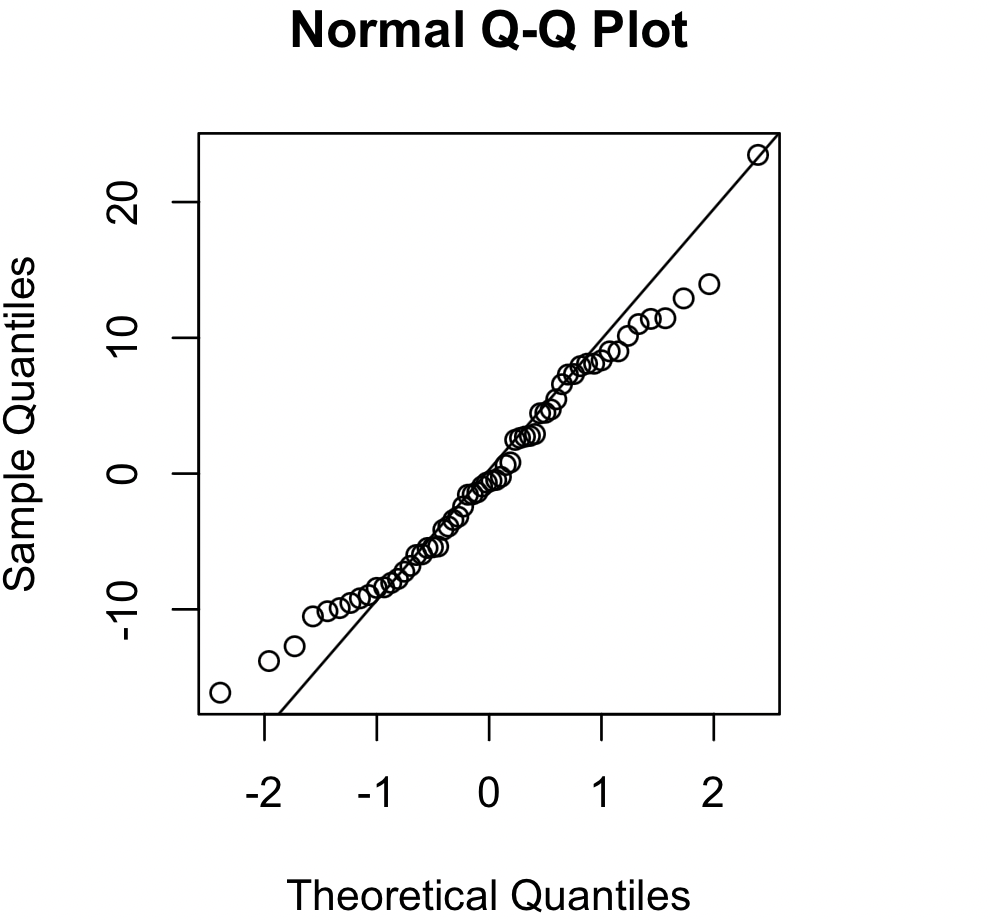
1
2
| q <- qnorm(res)
cor(q$x,q$y)
|
The coefficient of correlation: 0.9896158
Use the correlation test
t=1−r2rn−2∼tn−2
Here t=52.434,n=60.
The results are
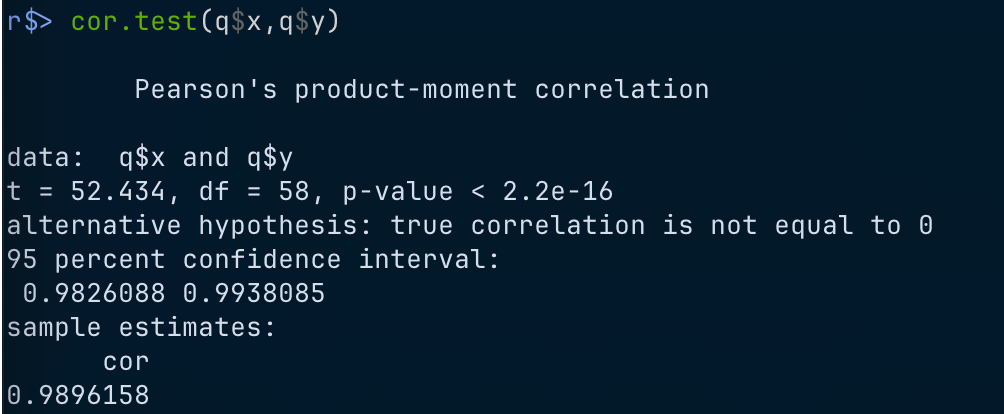
We have enough evidence to say that they have linear correlation.
1-e
Suppose
σi2=exp(α0+α1Xi)
The alternatives:
H0H1:α1=0:o.w.
The test statistic:
LM=2SSR∗/(nSSE)2=231833/(603874.4)2=3.817167
The decision rule:
LM>χ0.99,12=6.634897
The conclusion: cannot reject.
Prob-2
It is saying that the median is smaller than the mean, which usually indicates that the distribution is right-skewed.