WHETHER THERE EXISTS A NON-ZERO UNIT-LEVEL CAUSAL EFFECT?
The Principles
Keep in mind that we want to study the causal effects. Conducting hypothesis testing is a good way to do that.
The basic steps of hypothesis testing:
State the hypothesis
Choose a test statistic
Its distribution should be known when H0 holds
We should be able to calculate it with data at hand
Find the p-value
Compare with the given significance level
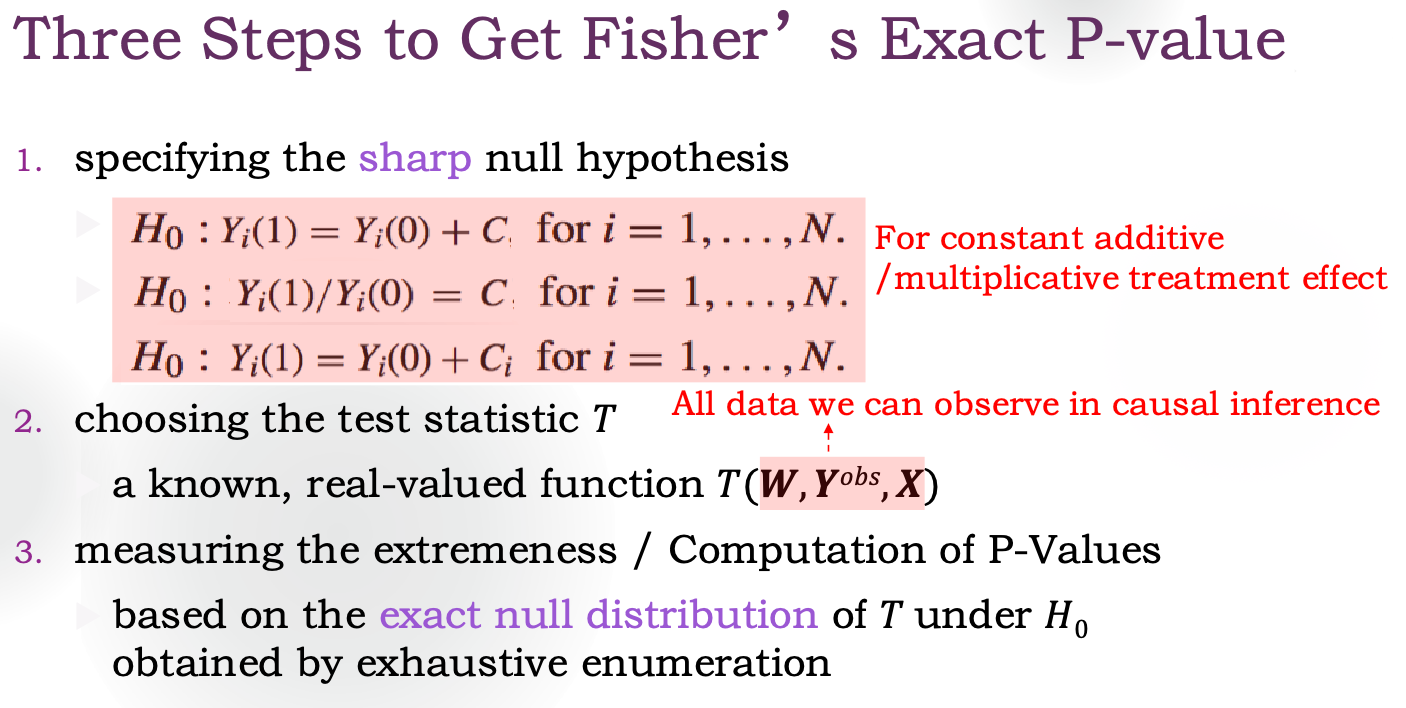
How to deal with the missing value problem? Fisher gave a solution: Fisher's sharp null hypothesis. It says:
H0:Yi(0)=Yi(0)∀i
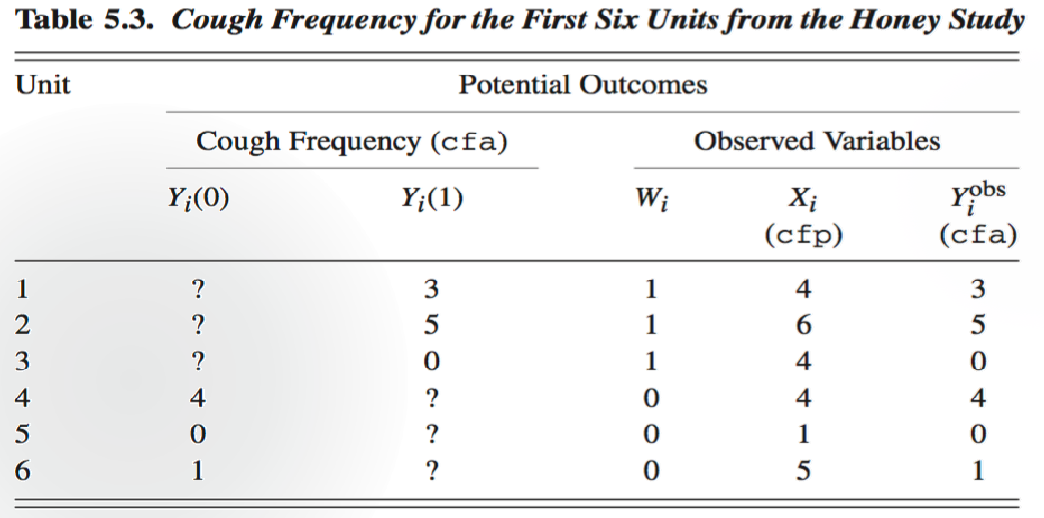
With H0, we can fill in all the missing potential outcomes.
Select the following as the test statistic:
Tdif=Yˉtobs−Yˉcobs
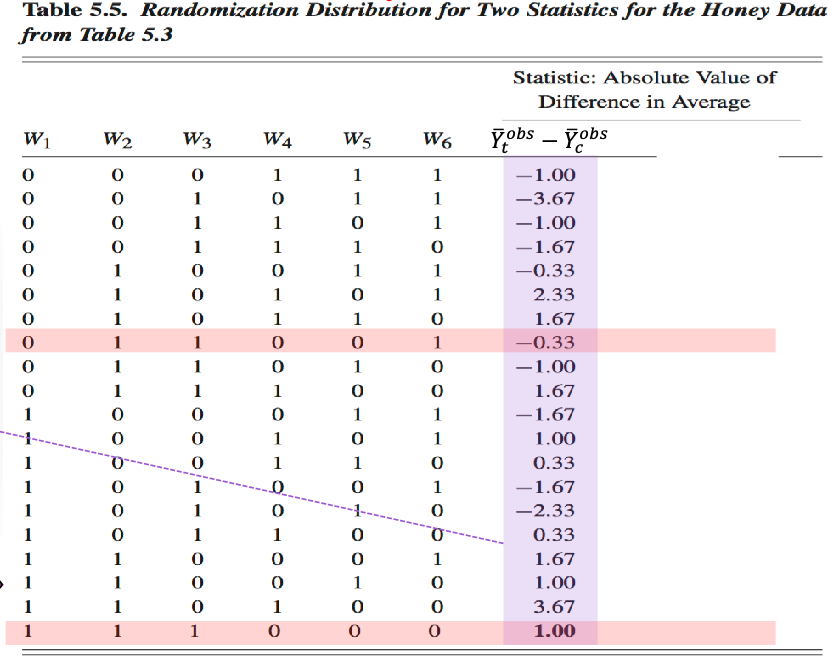
Note that the randomness in the r.v. comes from assignment. See this.
The next step is to find the null distribution of it. We enumerate all possible values of W.
In this case, we got 1.00. Recall the definition of the p-value: the probability of the outcome being as extreme as or more extreme than the observed. Under this setting, we see ≥1.00 and ≤−1.00 as extreme. Then the p-value is 2016=0.8.
Here is the summary slide. Note that
We can make various null hypothesis as long as long we can fill in the missing values with them.
All data we can observe can be used to construct the test statistic.
In Practice
Choosing the Test Statistic
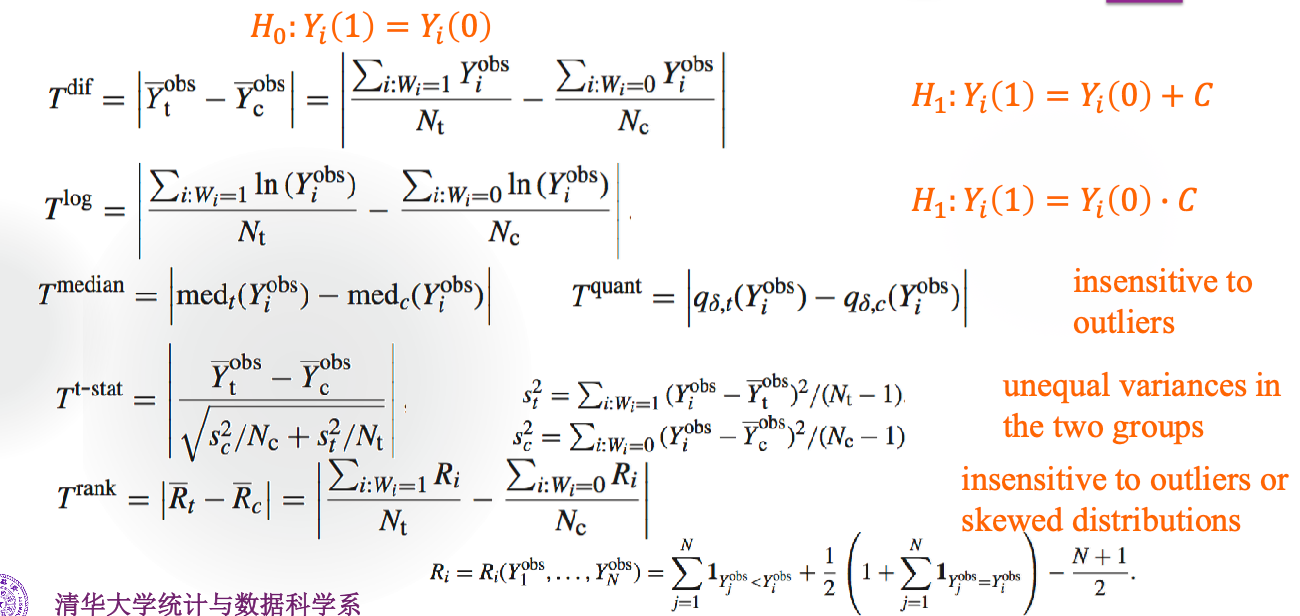
Many test statistics are proposed during class:
t: treatment, c: control
N: the total number of the units in this experiment
Nc: the number of units in control group
How to choose them? Recall that
Power=P(rejectH0∣H0 is false)
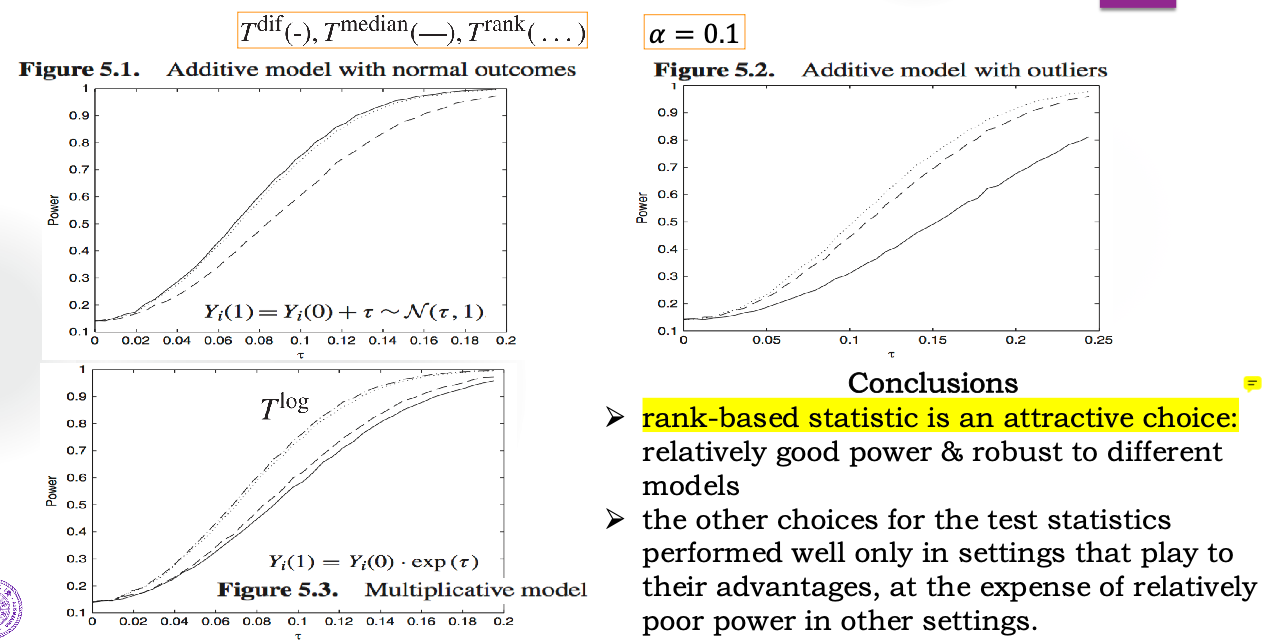
In the following figures, τ means the real causal effect. So the point where τ=0 says the probability of the type I error, thus all of the three statistics are valid. But their effectiveness is different.
Computation of P-Values
Computing exact p-value is very expensive when Nc,Nt are both large. Two methods to approximate it were proposed during class:
Approximate P-Value by Simulation
randomly choose a subset of K possible assignment vectors
For each assignment vector obtained, calculate its test statistics
Tdif,k=Yˉt,k−Yˉc,k
approximate the p-value by
p^=K1k=1∑K1Tdif,k≥Tdif,obs
The math behind it is:
Suppose there are N possible assignment vectors, and their corresponding Tdif's are x1,…,xN, and our observed one is xn. The real p-value is
p=N#{i:xi≥xn}
Let
Xk={1,0,if Tdif,k≥Tdif,obso.w.
Then Xk's are i.i.d. Bernoulli r.v.s with parameter p. According to the CLT
p(1−p)/KXˉ−p→dN(0,1)
Note that the s.e. has an upper bound of 1/2K
Approximate P-Value by Two-Sample T-Test
First introduce the Finite Population CLT:
Suppose the population is x1,…,xN, the population mean and population variance are
xˉ=N1∑xiS2=N−11∑(xi−xˉ)2
if we do random sampling without replacement with sample size n (it's equivalent to assign a random W), and get sample mean xˉsample. Then we have
E(xˉsample)=xˉVar(xˉsample)=(1−Nn)nS2
the derivation of the variance is similar to ^the-transformation. And when N→∞, if Nn→a∈(0,1) and no outlier in the population, we have
Var(xˉsample)xˉsample−xˉ→dN(0,1)
Note that is origin of randomness in xˉsample is the same as Yˉtobs−Yˉcobs: the assignment W. And the structures of them are similar, so Yˉtobs−Yˉcobs also has the approximate normality.
(the path to this conclusion is already paved by mathematicians (Slutsky), we just go through it)
So we can just do a two-sample t-test assuming equal variance on the data and get the p-value which can be used to approximate the p-value desired.
On the other hand, we can also replace S2 with Nt1st2+Nc1sc2 (see A Special Case), and
Ntst2+Ncsc2Yˉtobs−Yˉcobs→dN(0,1)
also holds, which means we can also use the p-value from two-sample t-test without assuming equal variance to approximate the p-value desired.
Neyman's Repeated Sampling Approach
HOW TO ESTIMATE THE AVERAGE CAUSAL EFFECT?
Limitations of Fisher's method:
The sharp null hypothesis is somewhat restrictive
Rejecting the null hypothesis itself cannot provide us an estimator of the unknown (average) treatment effect
Neyman's approach:
Focus on average causal effect instead of unit-level effect
Provide unbiased point estimator & interval estimator
Randomness: considering only finite population first
randomized assignment of treatments to the units in the sample
Estimation of ATE
Causal estimand (some value to be estimated):
τfs=N1i=1∑N(Yi(1)−Yi(0))=Yˉ(1)−Yˉ(0)
where
Yˉ(1)=N1i=1∑NYi(1),Yˉ(0)=N1i=1∑NYi(0)
Our estimator is
τ^dif=Yˉtobs−Yˉcobs
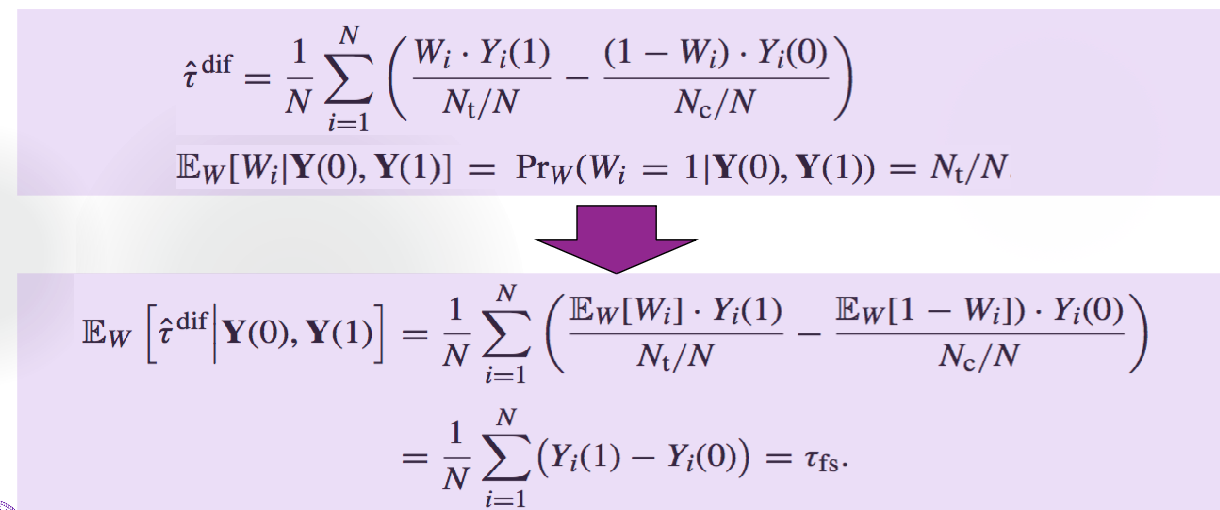
The estimator is unbiased:
Note that we are conditioning on Y(0),Y(1). Wait, but they are not r.v.s, what is the meaning of conditioning on them?
Building Confidence Interval
3 steps:
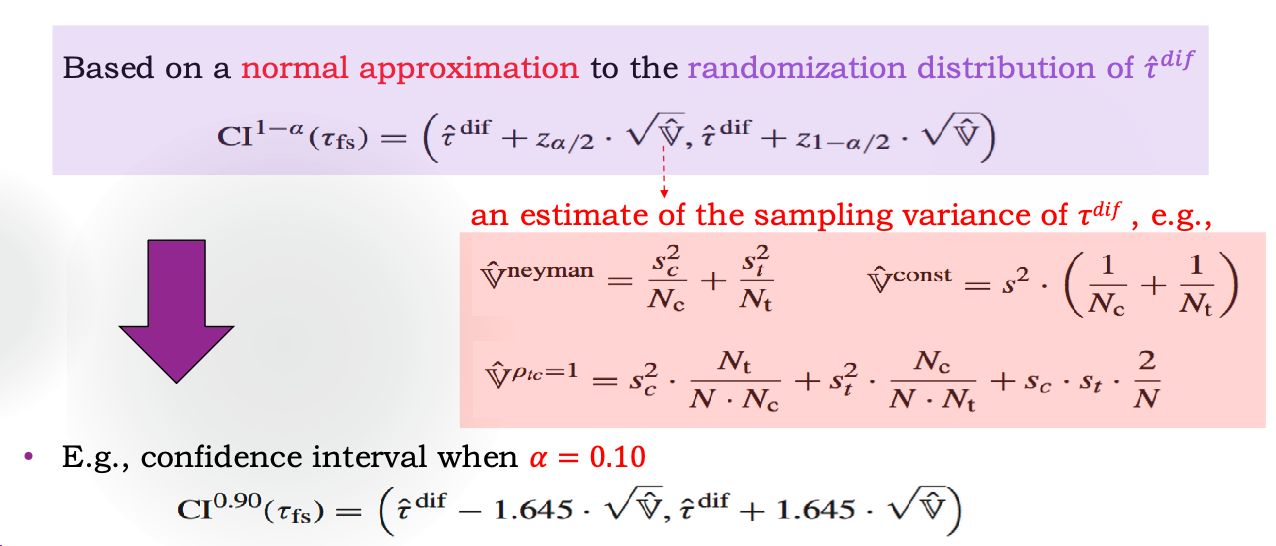
Derive the sampling variance of the estimator
Develop a estimator for the sampling variance
Create a large-sample confidence interval
Variance Deriving
Let's derive the sampling variance of τ^dif, first we separate parts with and without randomness:
τ^dif=Nt1i=1∑NWiYi−Nc1i=1∑N(1−Wi)Yi=Nt1∑WiYi(1)−Nc1∑(1−Wi)Yi(0)(partialing out Yi’s randomness)=∑[(NtYi(1)+NcYi(0))Wi−NcYi(0)]=∑AiWi−∑NcYi(0)
Before we start computing the variance, we derive Var(Wi) and Cov(Wi,Wj),i=j.
The finite units of size N can be viewed as a random sample from an infinite super-population where (Xi,Yi(0),Yi(1)) are i.i.d. draws (Xi is covariate).
Note that from now on Yi(0),Yi(1) have had randomness. All conclusions above can be seen as conditional given all (Yi(0),Yi(1))'s. (Below I use ∣Y to denote this.)